Custom Dashboards
Bring your scattered data into a single, decision-ready view built around how your team actually works.
Demo · Sample data only
Project Dashboard
Fictional project tracker — sample data, June 2026
- To Do422%
- In Progress528%
- Review422%
- Done528%
18 sample tasks by status
Who it's for
Problems we solve
- Key metrics spread across multiple disconnected tools
- Reports built manually in spreadsheets each week
- Leadership lacking timely visibility into operational health
- Inconsistent definitions of KPIs across departments
Key outcomes
- A single source of truth for the metrics that matter
- Time savings on recurring report preparation
- Faster, more confident decision-making
- Dashboards that evolve with your business
What's included
- 1Requirements and metrics-definition workshop
- 2Data source mapping and connection setup
- 3Dashboard design and build (web-based or embedded)
- 4Role-based access configuration
- 5Documentation and team walkthrough
- 630-day post-launch support window
Demo · Sample data only
Operations Dashboard
IT helpdesk snapshot — fictional data, June 2026
247
+12% vs last period
3.4h
-18% vs last period
31
+4 vs last period
94%
+2pp vs last period
Tickets opened vs resolved — last 6 weeks
Resolution rate improving week-over-week
Recent Tickets
| ID | Title | Priority | Status | Assignee |
|---|---|---|---|---|
| TK-1042 | VPN not connecting — remote team | High | In Progress | J. Marsh |
| TK-1039 | New laptop provisioning — 3 devices | Medium | Pending Approval | A. Patel |
| TK-1036 | Salesforce login loop — sales team | High | Resolved | D. Kim |
| TK-1031 | Printer offline — 2nd floor | Low | Resolved | J. Marsh |
| TK-1028 | SharePoint permissions audit | Medium | In Progress | A. Patel |
| TK-1024 | MFA enrollment for new hires | Low | Resolved | D. Kim |
Click any row to drill down ↑
Want a dashboard like this for your business?
We design and build custom operational dashboards — connected to your real data sources, branded to your team.
Estimate the value of reducing manual work — in ranges, not promises
Effort & cost inputs
What might your manual overhead be costing you?
Fill in what you know — approximations are fine. We'll show estimated ranges, not precise figures.
How many people spend time on this work?
Manual steps, chasing data, duplicated effort
Fully loaded — salary + overhead
Fixing errors, re-entering data, correcting reports
Manual report building, data pulls, slide prep
Estimated automation reduction
Conservative (30%), moderate (50%), or aggressive (70%) — we'll use this to model the range.
All outputs are estimated ranges only — not commitments, projections, or financial advice. Actual impact depends on your specific situation.
Proven execution
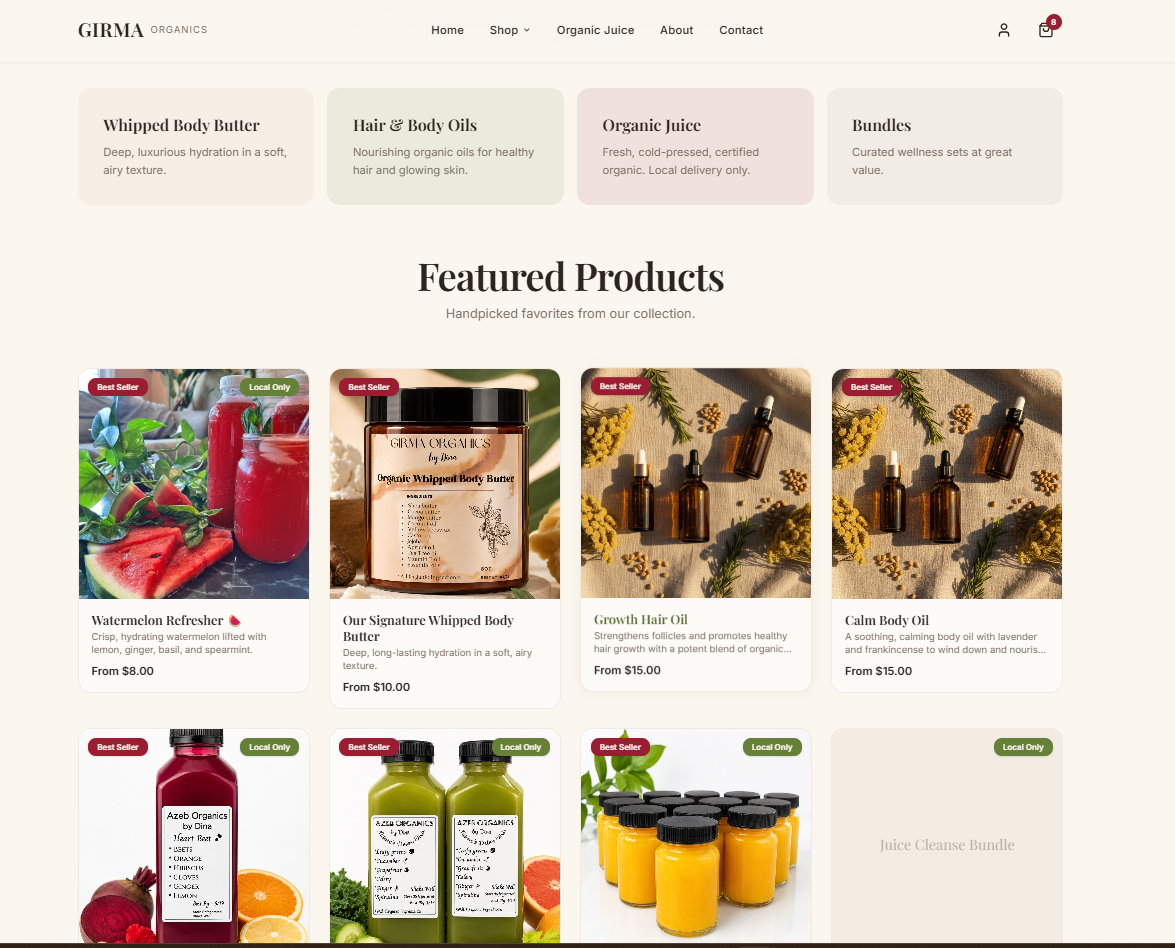
Girma Organics
Girma Organics is a wellness brand selling organic body butter and organic juices. It started as a neighborhood operation, and as demand grew, so did the work behind it — coordinating orders, inventory, and vendor communications through a patchwork of email threads and manual, local effort. The business had no online presence and no infrastructure to sell or fulfill beyond its immediate community, which put a ceiling on how far it could grow.
Read the case study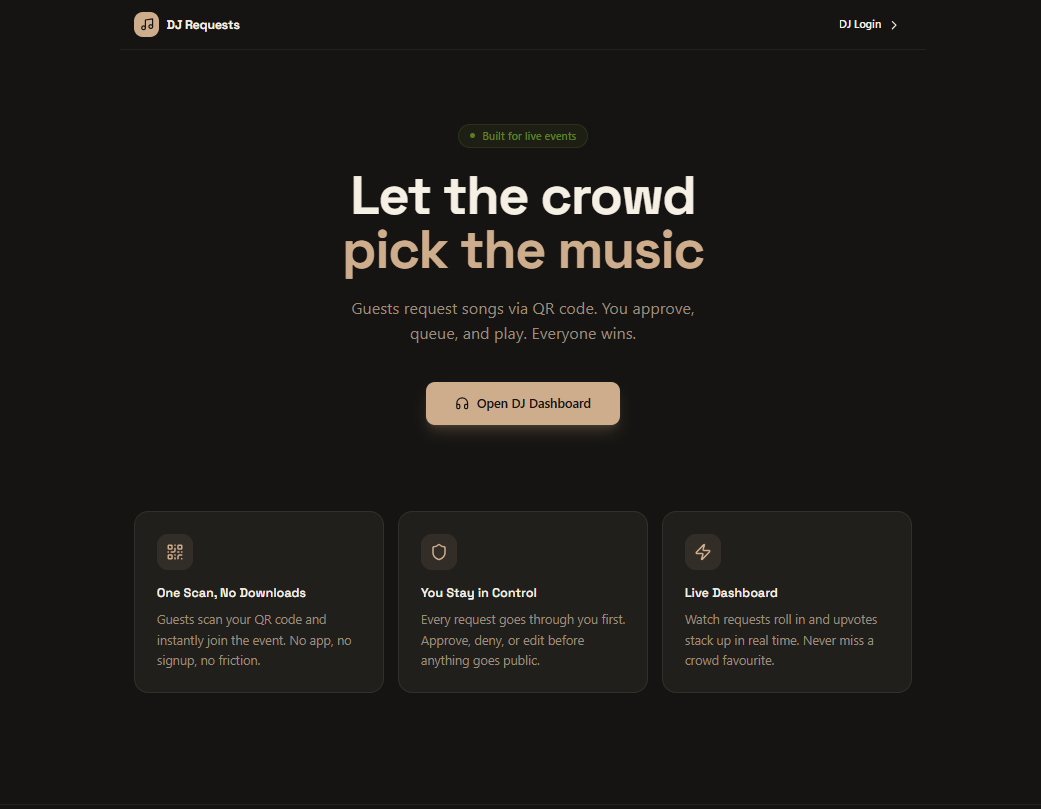
Finessional Events LLC
Finessional Events is a small DJ and event-coordination company running live events where the crowd's energy depends heavily on playing the right music at the right moment. Song requests came in the way they always had — guests shouting over the music, flagging down the DJ mid-set, or passing requests through friends. The requests that made it through were easy to lose, impossible to prioritize, and gave the team no record of what the room actually wanted.
Read the case studyPricing
Custom — request a quote
Get a QuoteRelated solutions
Website/WebApp DesignFeatured
Professional, performance-focused websites designed to represent your brand and convert the right visitors.
Workflow & AI Automation
Replace manual, repetitive processes with structured automated workflows — and, where it makes practical sense, scope AI-assisted steps into them.
Custom Apps
Custom web apps and internal operations platforms built around how your team works — including modern replacements for aging legacy systems.
Frequently asked questions
Ready to explore Custom Dashboards?
A free discovery call is the right first step. We'll scope the engagement and tell you honestly whether we're the right fit.